 |
| Monitoring Dashboard with charts - credit pixabay |
Getting insights into performance, availability and health status of infrastructure and application is very critical for building and managing reliable systems. When we are dealing with clusters of instances, it is becoming very challenging to collect, aggregate and derive actionable insights from data in real time. There are monitoring tools available to address this challenge, both open source and commercial products, we are going to discuss about how to achieve real-time log streaming analytics and monitoring in Google Cloud Platform.
Google Cloud Platform (GCP) provides Cloud Monitoring service to gather system and application statistics and Cloud Logging service to collect and stream logs from system and third-party application. Also, it provides options to enable alerting and integration with incident management tools. To make things interesting let's implement the log streaming and metrics monitoring of Nginx instance. Let me give you quick background of the example application In recent years, I have been predominantly using Google Cloud Platform for hosting Machine Learning workloads and applications. Architecture of the system is not in scope of this article, I will write a separate post on that later, however in simple terms, for computing I have been using Compute Engine Instance Groups consists of Linux Virtual Machines with attached GPUs. Inference engine APIs are hosted on Flask and Gunicorn web server and served through Nginx reverse proxy and traffics are served and managed through Internal HTTPS load balancers and Global Load Balancers.
For gathering system and application metrics and sending to Cloud Monitoring, we need to install Cloud Monitoring Agent on Virtual Machine instance and collecting third-party application logs and streaming to Cloud Logging requires installation of Cloud Logging Agent on Virtual Machine instances. To explore the metrics and create charts to visualize we will use Metric Explorer, and to analyse and explore the logs, we will use Log Explorer interface. In addition to this, we need Nginx monitoring plugin for collecting Nginx application metrics. We will also cover about creating custom monitoring dashboards, widgets, Nginx metrics, Log based metrics, etc.
Topics covered:
- Cloud Monitoring Agent Introduction
- Cloud Monitoring Agent installation through SSH
- Cloud Monitoring Agent installation through Google Cloud Console
- Nginx Monitoring plugin Introduction
- Enabling Nginx status page
- Enabling Nginx monitoring plugin
- Cloud Monitoring Dashboard
- Dashboard Widgets
- Nginx Application Dashboard
- Nginx metrics monitored in Google Cloud Monitoring
- Exploring Nginx Metrics in Cloud Monitoring Metrics Explorer
- Cloud Logging Agent Introduction
- Cloud Logging Agent installation through SSH
- Cloud Logging Agent installation through Google Cloud Console
- Enabling Structured Logging in Google Cloud Logging
- Exploring Nginx Logs in Google Cloud Logging - Log Explorer
- Filtering Nginx Logs in Log Explorer
- Real-time streaming of Nginx Logs
- Creating Log based metrics
- Cloud Monitoring Agent – Administrative Tasks
- Restarting and checking status of Cloud Monitoring Agent
- Configuring HTTP proxy for Cloud Monitoring Agent
- Uninstalling Cloud Monitoring Agent
- Cloud Logging Agent – Administrative Tasks
- Restarting and checking status of Cloud Logging Agent
- Configuring HTTP proxy for Cloud Logging Agent
- Uninstalling Cloud Logging Agent
- Summary
- Resources
Cloud Monitoring Agent – Introduction:
The Cloud Monitoring Agent is based on the collectd – the system statistics collection daemon, which gathers system and application metrics from Virtual Machine instances and sends them to monitoring. This system gathers information from various sources, e.g. the operating system, applications, logfiles, and external devices and sends them to Google Cloud Monitoring. These metrics can be visualized through graphs, charts, dashboards and used to monitor systems, find performance bottlenecks and capacity planning, etc. The collectd is written in C for performance and portability, so we can be confident that this will not create additional overhead on the instance. Monitoring agent used to collect CPU, Memory, Disk, Network, system resources and third-party applications
Installation:
The Cloud Monitoring Agent can be installed in below methods
- Installing through SSH
- Installing through Google Cloud Console – installation workflow
Cloud Monitoring Installation through SSH:
- SSH into your Virtual Machine instance and create a directory monitoring
- Change directory to monitoring and download the Logging Agent installation script
- Run the below command to add the repository and install the agent in your machine
- To verify the status of the Google Cloud Logging agent, run the below command
- Run the below command to add the repository and install the agent in your machine
Cloud Monitoring Installation through Google Cloud Console:
Log into Google Cloud Console and navigate to: Google Cloud Console Menu -> Monitoring -> Dashboards -> VM Instances -> Inventory. This page will provide about current status of Monitoring Agent.
 |
| Google Cloud Monitoring - VM Instances Inventory |
Click on the Install Agent button - it will open the agent details page with installation workflow, once you click on Install Agent, Google Cloud Shell will open with installation command, press Enter to complete the installation.
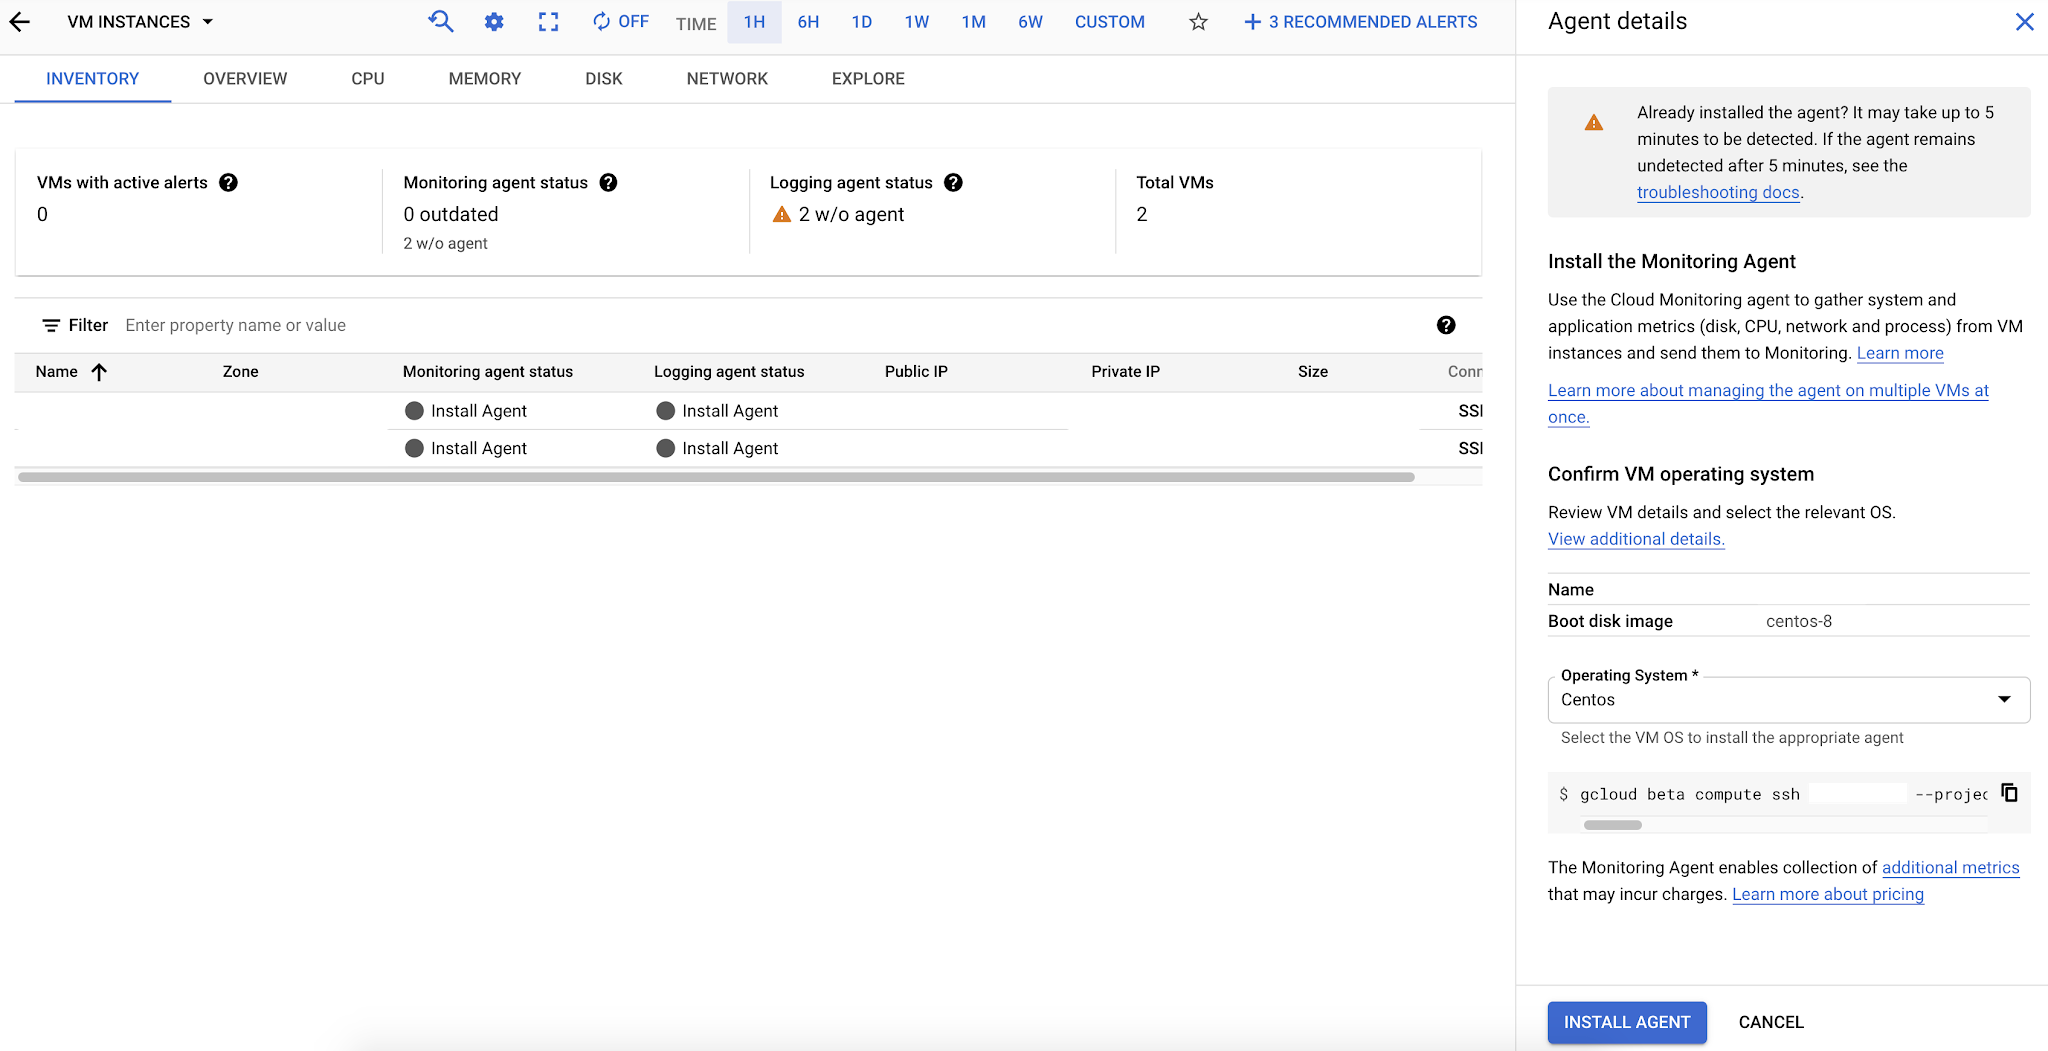 |
| Google Cloud Monitoring - Agent Installation Details |
Nginx Monitoring plugin:
We have successfully installed the Google Cloud Monitoring Agent, now let’s install and configure the Nginx monitoring plugin. By default the Google Cloud Monitoring Agent can discover the Nginx logs based on configuration file and stream to Cloud Monitoring and additionally Google Cloud Logging Agent also streams logs to Logging Explorer, however we are proceeding with installing Nginx monitoring plugin to create a Nginx Application Dashboard where all Nginx instances can be monitored at a time.
Nginx monitoring installation involves 2 steps, configuring nginx_status handler to enable nginx status page and enabling Nginx monitoring plugin.
Enabling and configuring Nginx status page
- Create a new configuration file status.conf inside your nginx configuration directory /etc/nginx/conf.d/
- Add the below directives inside status.conf file – or you can download this file from https://github.com/Stackdriver/stackdriver-agent-service-configs/blob/master/etc/nginx/conf.d/status.conf and save it in configuration directory.
- Alternatively, you can append the above code block in your Nginx configuration file – generally located at /etc/nginx/nginx.conf
- Reload the Nginx configuration by running:
Enabling Nginx monitoring plugin:
Download the nginx.conf file from https://github.com/Stackdriver/stackdriver-agent-service-configs/blob/master/etc/collectd.d/nginx.conf and save it place it under the Cloud Monitoring Agent location /etc/stackdriver/collectd.d/
Restart the Cloud Monitoring Agent by running the below command:
To check the Cloud Monitoring Agent status:
Cloud Monitoring Dashboard:
Monitoring dashboard is one of the ways to view and analyse your metrics in Google Cloud Platform. Google Cloud Platform provides dashboards for most of the Google Cloud Services without any effort from our end. It also provide options to monitor custom metrics thorough custom dashboard. We have option to add Line Chart, Stacked area chart, Stacked bar chart, Heatmap chart, Gauges, Scorecards and textboxes widgets to our custom dashboard as required.
Nginx Application Dashboard
As we have already added, Nginx monitoring plugin, we should be able to see Nginx Application dashboard in our Monitoring Dashboard page. Navigate to Google Cloud Console -> Monitoring -> Dashboard to see Nginx dashboard:
 |
| Google Cloud Monitoring - Nginx Application Dashboard |
Click on Nginx Application dashboard (you can use Filter Dashboard to navigate quickly, if you have many dashboards) to see Nginx monitored metrics.
 |
| Cloud Monitoring Dashboard - Nginx Metrics Dashboard |
Nginx Metrics monitored in Google Cloud Monitoring:
By default, Nginx monitoring plugin collects following metrics:
 |
| Google Cloud Monitoring - Nginx Monitoring Plugin Metrics |
Additionally, you can navigate to metrics explorer from Nginx dashboard by clicking on View in Metrics Explorer
 |
| Google Cloud Monitoring - Charts View in Metrics Explorer |
Exploring Nginx Metrics in Cloud Monitoring Metrics Explorer
Metric Explorer lets you explore data and build charts from the monitored metrics. Navigate to metrics explorer through Google Cloud Console -> Monitoring -> Metrics Explorer:
 |
Google Cloud Logging Agent
Google Cloud Logging Agent is an application based on Fluentd – an open source data collector for unified logging layer. The Logging agent streams data from common-third party applications such as Nginx, MySQL, PostgreSQL, etc and system software to Google Cloud Logging. Also provides configuration option to add custom logs. This architecture allows to unify log data collections and consumption for a better understanding of data and leads to actionable insights. Google Cloud Platform suggests to install the Logging Agent to all the VM instances and it supports both Linux and Windows.
Installing Cloud Logging Agent:
Cloud Logging Agent can be installed in below methods:
- Installing Cloud Logging Agent through SSH
- Installing Cloud Logging Agent through Google Cloud Console.
Cloud Logging Agent installation through SSH
- SSH into your Virtual Machine instance and create a directory monitoring
- Change directory to monitoring and download the Logging Agent installation script
- Run the below command to add the repository and install the agent in your machine
- To verify the status of the Google Cloud Logging agent, run the below command
- If any errors, you can verify the system logs for troubleshooting
Cloud Logging Agent installation through Google Cloud Console:
You can install the Logging Agent from Google Cloud Monitoring page. For this, log into Google Cloud Console and navigate to below page:
Google Cloud Console Menu -> Monitoring -> Dashboards -> VM Instances -> Inventory. This page will provide information about current status of Logging Agent.
 |
| Google Cloud Logging - installing Cloud Logging Agent through Cloud Console |
Click on the Install Agent button – it will open the installation workflow on the same page and click install to continue.
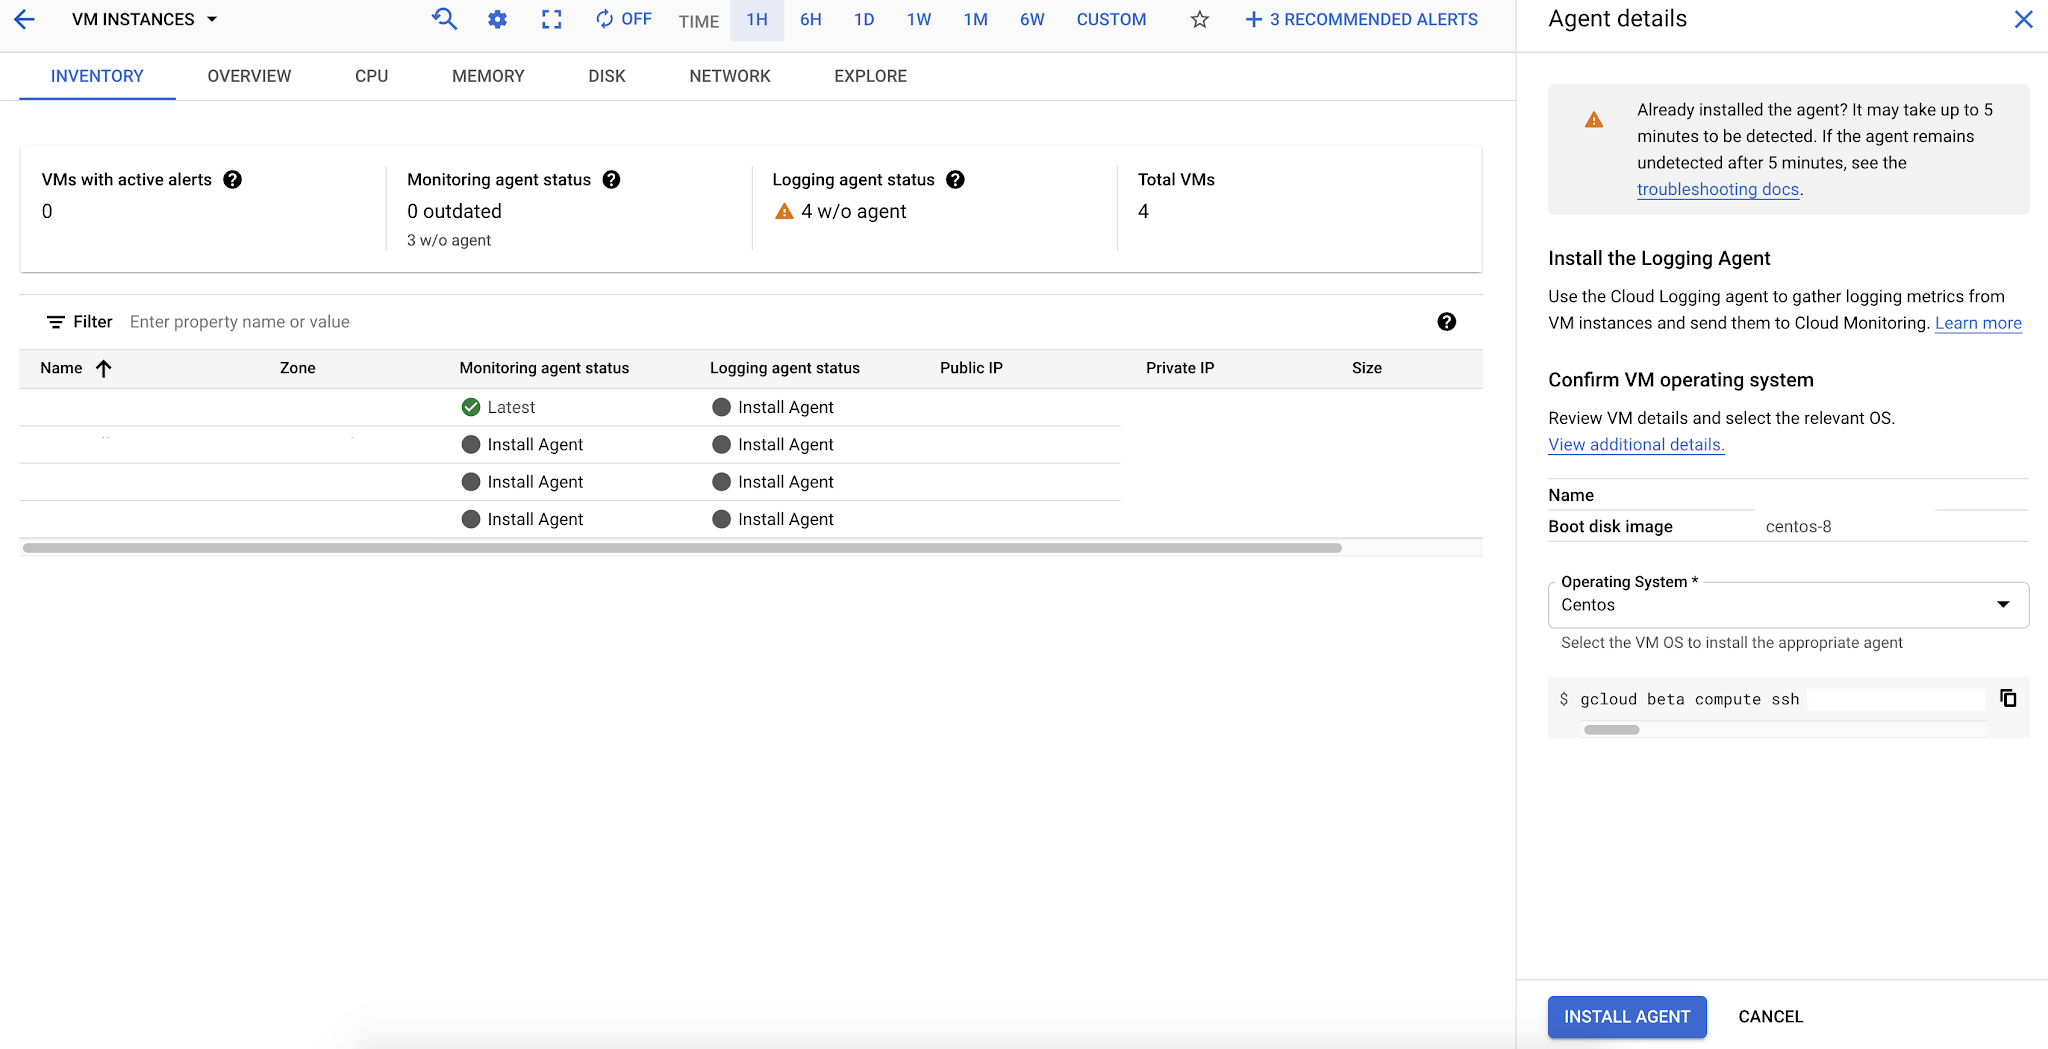 |
| Cloud Logging Agent Installation |
Enabling Structured Logging:
We have successfully installed the Google Cloud Logging Agent, now let’s enable the structured logging. In Google cloud logging, structured logs refers to log entries that use jsonPayload field to add structure to their payloads. Structured logs are easy to read and optimal for filtering, this is super helpful when you are filtering the log records later.
To enable structure logging, run the below command, this will uninstall the default google-fluentd-catch-all-config packages and install the google-fluentd-catch-all-config-structured
Uninstalling Cloud Logging Agent:
Installing Cloud Logging Agent - Structured Logging packages:
Restarting Cloud Logging Agent:
Check status of Cloud Logging Agent:'
Exploring Nginx Logs in Google Cloud Logging - Log Explorer
Google Cloud Platform provides Log Explorer interface to retrieve, view and analyse logs from VM instances. We have already configured Cloud Logging Agent on our Nginx VM instance, we can directly query Nginx logs from Log Explorer.
Navigate to Log Explorer Google Cloud Console -> Logging -> Log Explorer to query Nginx logs.
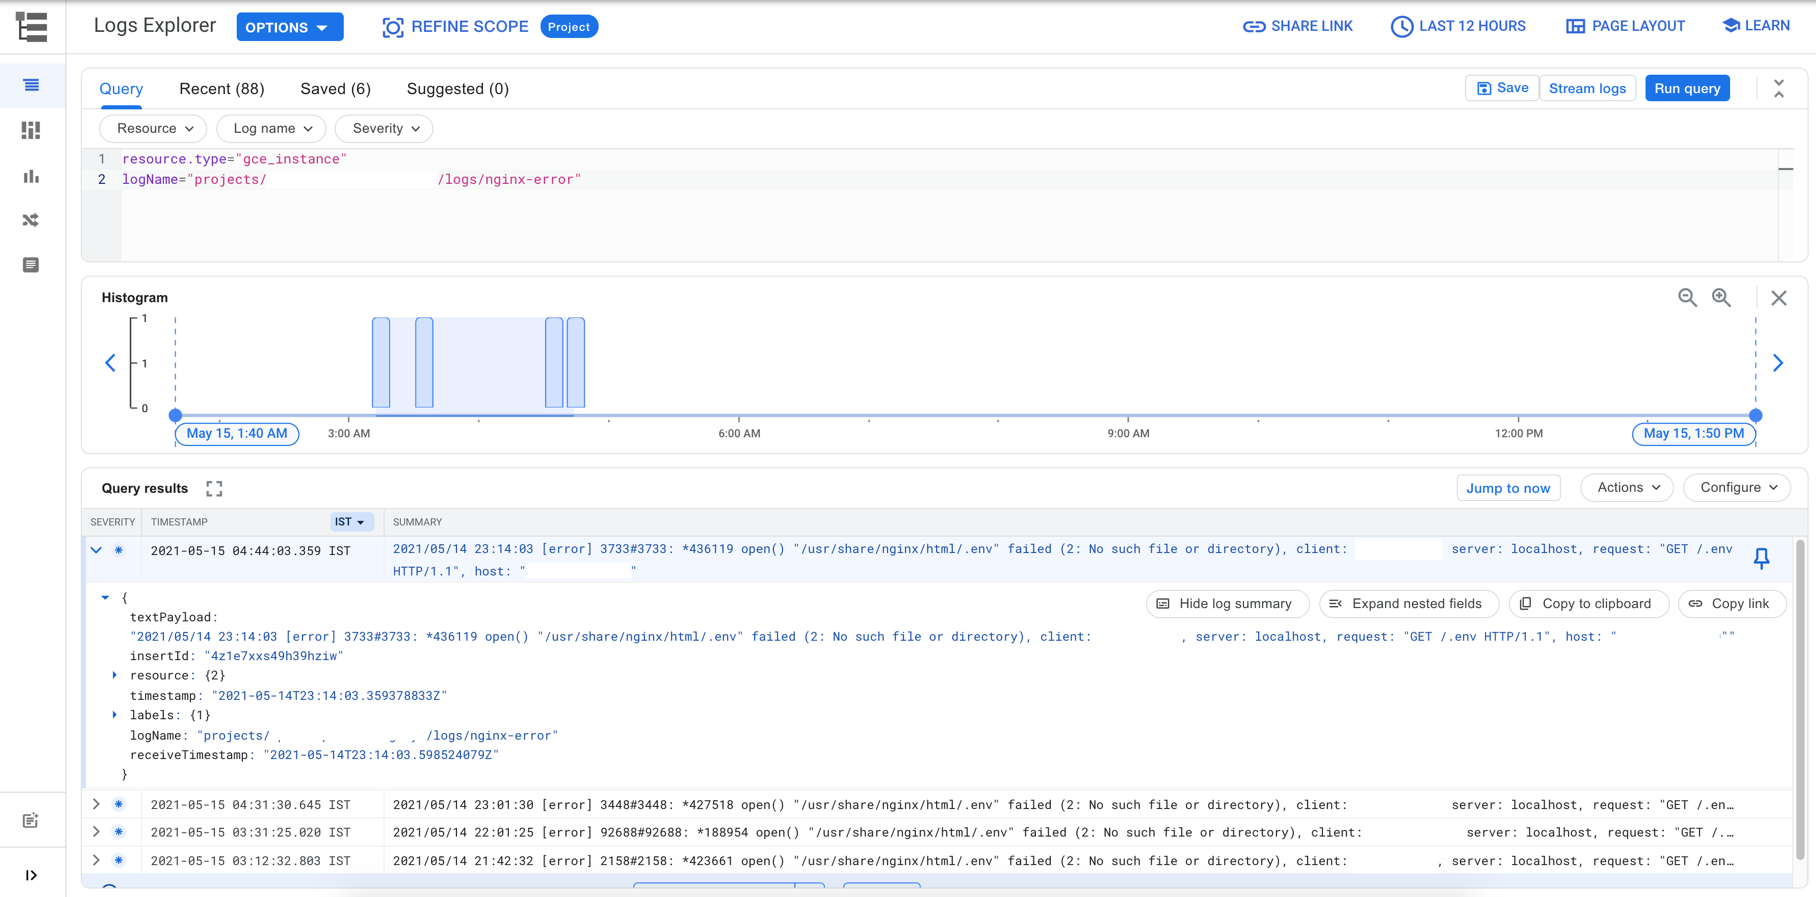 |
| Viewing Nginx Logs in Google Cloud Log Explorer |
Filtering Nginx Logs in Log Explorer:
- Resource drop down - provides list of all Google Cloud services and Cloud Logging Agent Resources select the Nginx VM instances names
- Log name drop down - provides list of all streamed logs – select the nginx-access and nginx-error logs to get the Nginx Access log and Nginx Error log.
- Severity - leave default to get all severity levels such as Default, Info, Warning, Error, Critical, etc.
You can write your own queries and apply filtering, also you can save those queries for later stream. Sample Nginx Access Log filtering given below:
 |
| Filtering Nginx Logs in Google Cloud Logging - Log Explorer |
Real-time streaming of Nginx Logs:
Log Explorer provides option to stream the logs real-time, this is super useful, when you are troubleshooting issues and all filters will be applied on the log stream as well. Click on the Start stream button to stream logs, once done, you can use Stop stream button to stop the streaming
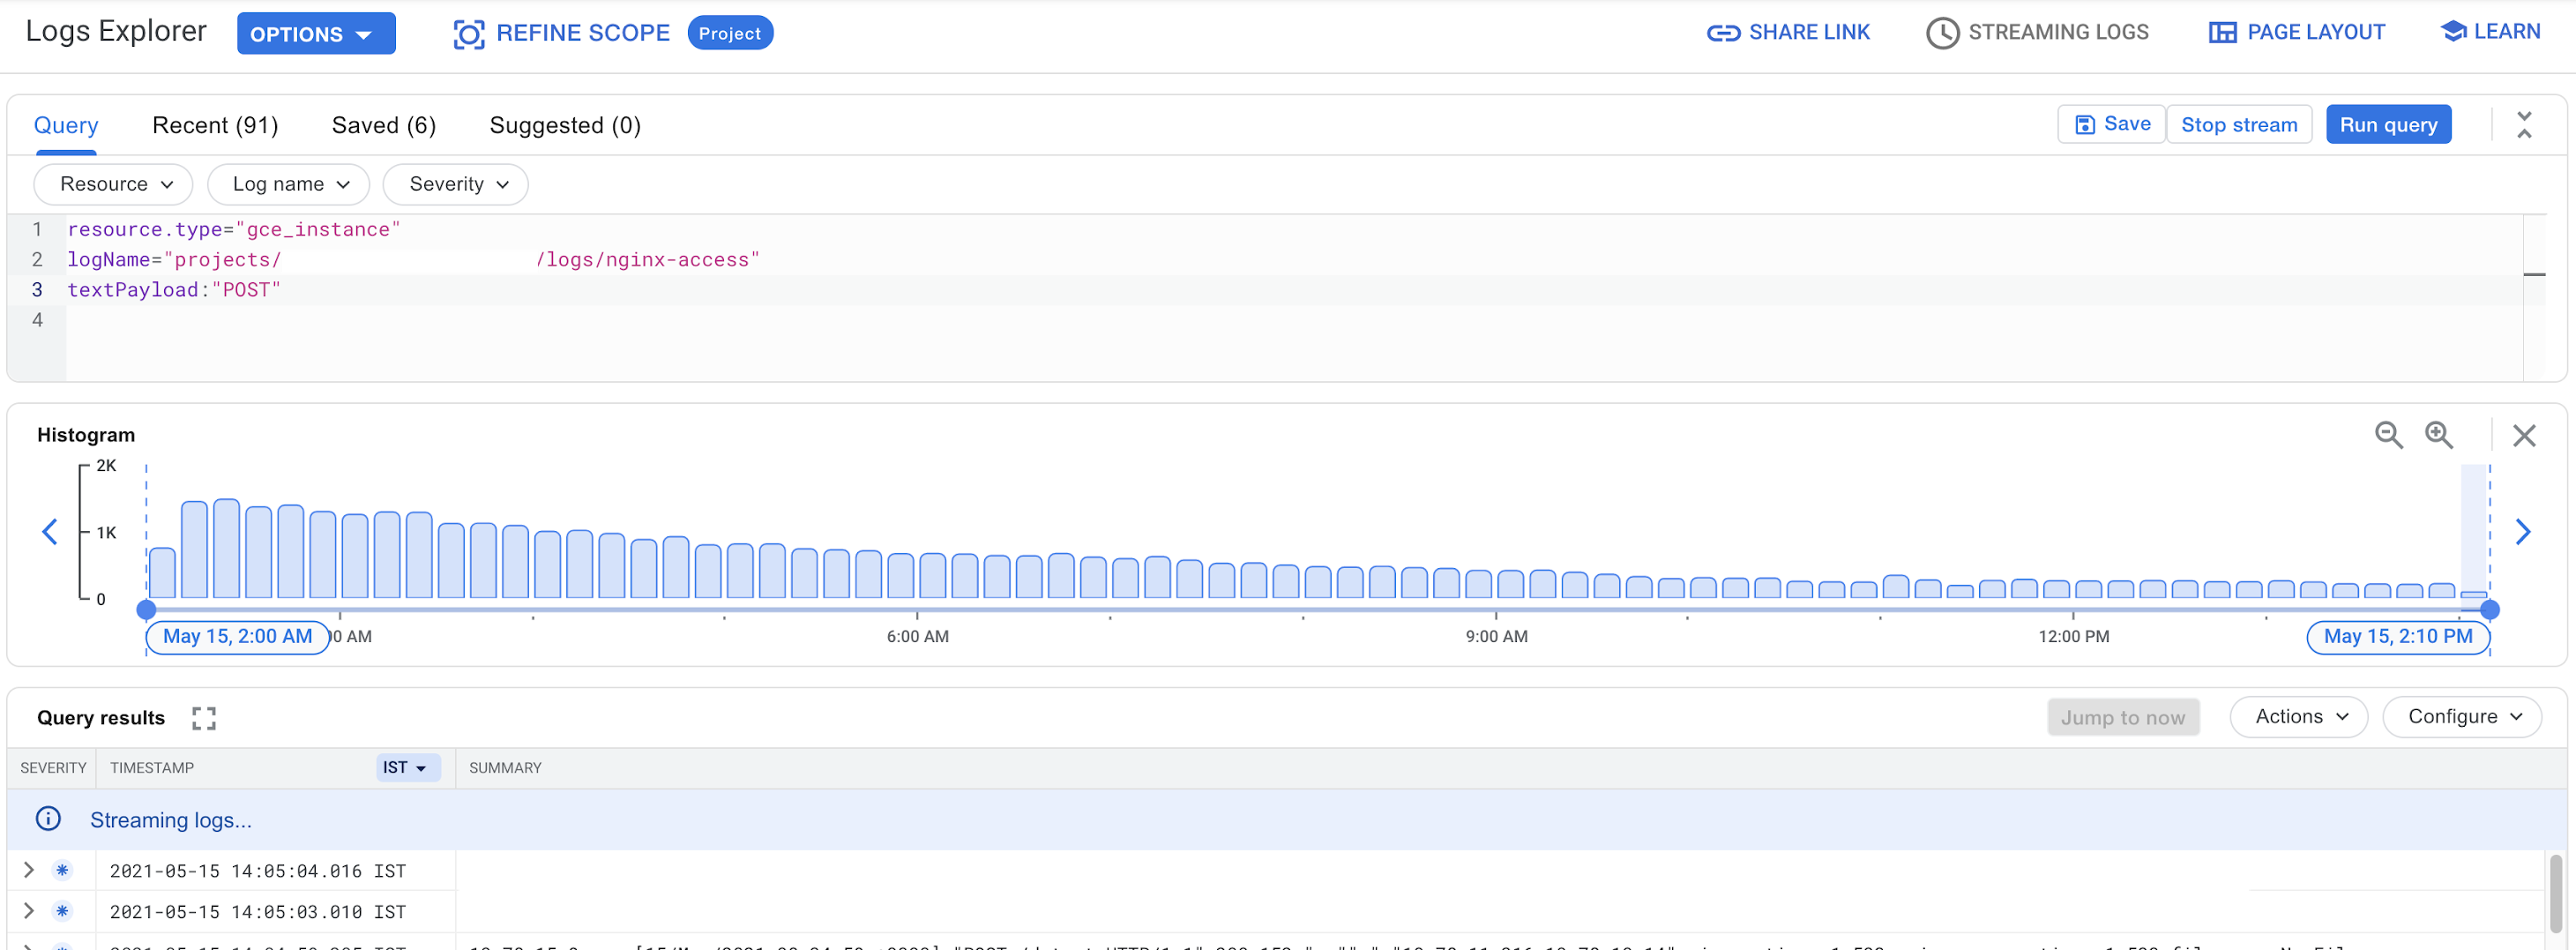 |
| Real-time streaming of Nginx Logs - Google Cloud Logging - Log Explorer stream |
Creating Log based metrics:
Log based metrics are useful when you need to monitor a metric based on the content of file. For example, consider you need to measure the total number of POST request served by the Nginx. A Log based metric can be either a Counter type or Distribution type. Our example is type of Counter metric – count the number of log entries matching a given filter and Distribution metric accumulates numeric data from log entries matching a filter.
To create Log based metric click on Actions -> Create Metrics link. This will open Log based metrics page, where you can config a new metrics based on the log content.
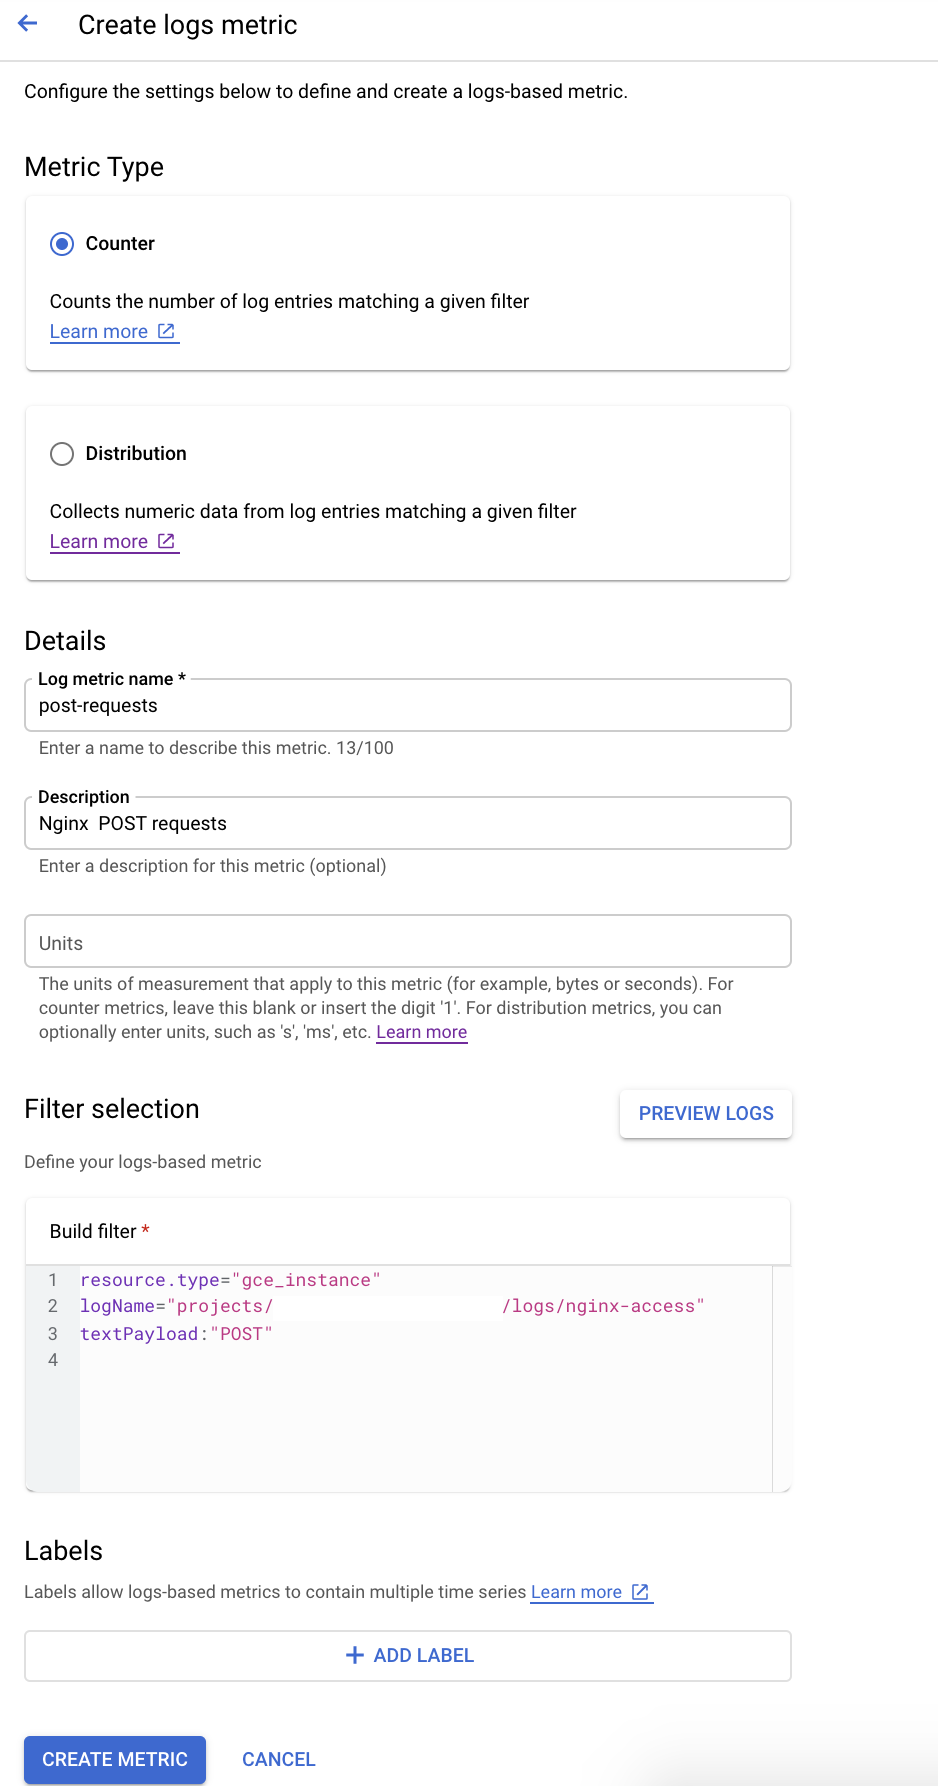 |
| Google Cloud Logging - Creating Log Based metrics |
Also, you can use this Log based metrics in Metrics Explorer and create visualization and can be added to your custom dashboards.
Cloud Monitoring Agent – Administrative Tasks
In this section, we will discuss about how to restart and check status of the Cloud Monitoring Agent, configuring HTTP proxy for Cloud Monitoring Agent and Uninstalling Cloud Monitoring Agent.
Restarting & checking status of Cloud Monitoring Agent:
Restart:
Configuring HTTP Proxy:
Edit the Cloud Monitoring Agent configuration file:
Restart the Cloud Monitoring Agent:
Uninstalling Cloud Monitoring Agent:
Run the below command to uninstall the Cloud Monitoring Agent:
Cloud Logging Agent – Administrative Tasks
In this section, we will discuss about how to restart and check status of the Cloud Logging Agent, configuring HTTP proxy for Cloud Logging Agent and Uninstalling Cloud Logging Agent.
Restarting & checking status of Cloud Logging Agent:
Restart:
Status:
Configuring HTTP Proxy:
Edit the Cloud Logging Agent configuration file:
Add the proxy details:
Restart the Cloud Monitoring Agent:
Uninstalling Cloud Monitoring Agent:
Run the below command to uninstall the Cloud Monitoring Agent:
Summary
We have covered the following topics in this article and I hope this will be helpful in implementing monitoring solution for your application. Share your comments and queries below in the comment section.
- Cloud Monitoring Agent and installing, configuring Cloud Monitoring Agent on Linux Virtual Machines
- Cloud Logging Agent and installing, configuring Cloud Logging Agent on Linux Virtual Machines
- Nginx monitoring Plugin and enabling Nginx status page and enabling Nginx monitoring from Cloud Monitoring Agent
- Monitoring dashboards, different types of widgets and Nginx Application Dashboard, exploring Nginx metrics in Cloud Monitoring Metrics Explorer interface
- Viewing and analysing log data in Cloud Logging Log Explorer interface and real-time streaming logs through Log Explorer and creating Log based metrics
- Cloud Monitoring Agent and Logging Agent administrative tasks such as restarting, checking status, configuring proxy and uninstallation.
Additional Resources
Google Cloud Console: https://console.cloud.google.com/
Nginx Logging: https://docs.nginx.com/nginx/admin-guide/monitoring/logging/
Cloud Monitoring Agent: https://cloud.google.com/monitoring/agent/monitoring
Cloud Logging Agent: https://cloud.google.com/logging/docs/agent/logging
Fluentd Architecture: https://www.fluentd.org/architecture
collectd: https://collectd.org/index.shtml
0 thoughts:
Post a Comment